Recession fears in Europe punish risky borrowers with higher yields

Roula Khalaf, Editor of the FT, selects her favourite stories in this weekly newsletter.
A powerful rally in risky financial assets has left behind Europe’s weakest corporate borrowers, with recession fears persisting in the region just as optimism grows about a US “soft landing”.
Europe’s riskiest corporate bonds now have an average yield of 19.66 per cent, according to an Ice BofA index tracking regional debt rated triple C and lower. That translates into a spread — the premium paid by companies over government debt issuers — of more than 18 percentage points.
By contrast, the lowest-rated US corporate bonds have an average yield of 13.47 per cent, with a much smaller spread of less than 9 percentage points. The difference between the two regions’ risky credit spreads this month has hovered at its widest level since the global financial crisis in 2009.

For some economists and investors, the gulf between those spreads underscores diverging sentiments about the health of the European and US economies.
“It really does reflect mainly these fears and risks of a recession in Europe relative to a ‘soft landing’ in the US,” said Torsten Sløk, chief economist at investment firm Apollo. The US scenario involves the Federal Reserve successfully cooling the world’s biggest economy without inducing a sharp downturn.
“Europe is certainly looking far weaker than the backdrop in the US. It’s likely that Europe is in recession, or very close to it, and that has been the case since really the third quarter of this year,” said Mike Scott, head of global high-yield and credit opportunities at hedge fund Man Group GLG.
As recently as early November, investors on both sides of the Atlantic were fearful about the implications of “higher for longer” interest rates, as central banks continued to wage battle against inflation. In the US, the Fed has raised borrowing costs from near zero in March last year to a target range of 5.25-5.5 per cent, while the European Central Bank has taken its rate to 4 per cent.

But concerns about further Fed tightening gradually eased last month on signs of cooling economic growth. Any residual fears were extinguished last week, when policymakers indicated they expected to cut interest rates by 0.75 percentage points in 2024, with Fed chair Jay Powell giving his strongest signal yet that the tightening cycle was over.
Markets have since rallied strongly, with Treasury yields dropping sharply and US stocks leaping higher. However, ECB officials have pushed back against hopes of imminent relief on borrowing costs.
Powell “is signalling that he is more confident [about] a soft landing in the US”, said Sløk. But “with the ECB being more hawkish last week . . . the fear is that we get a ‘hard landing’ in Europe”.
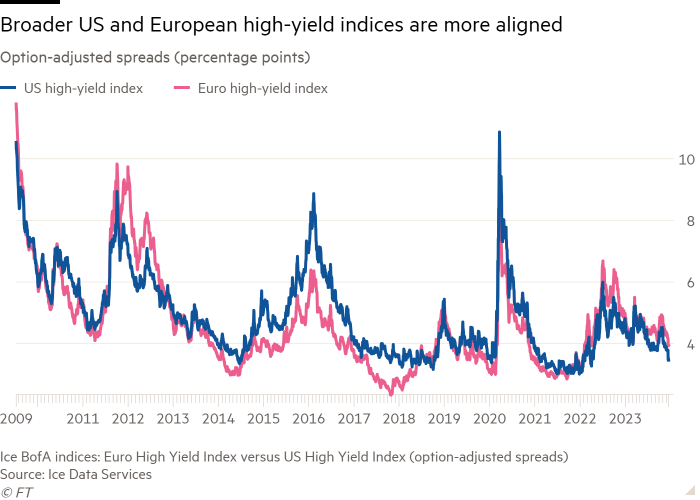
The divergence between European and US credit spreads has played out primarily at the weakest end of the credit quality spectrum. Moves in the broader junk bond indices for both regions, spanning a wider range of ratings, have been more aligned.
The average spread on the broader US high-yield bond index has tightened by 1.01 percentage points since November 1 to 3.46 percentage points, with most of that move occurring this month. Over the same timeframe, the spread on the European junk bond index has narrowed by 0.88 percentage points to 3.94 percentage points.
But in triple-C territory, the US spread has tightened by 1.62 percentage points since November 1, with 0.81 percentage points of that move occurring this month. That compares with a tightening of just 0.04 percentage points for the European index since early November, and a slightly more pronounced narrowing of 0.2 per cent in December.
“Triple-Cs clearly struggle in recessionary environments,” said Scott. “Their ability to generate cash is ultimately what is being priced.”

Strategists also stressed that the European triple-C index is much smaller than the US gauge and more easily influenced by individual companies — complicating the comparison between the two. The index is worth just $26.8bn in dollar terms, compared with a value of $172bn for the US gauge, according to Ice BofA data.
“The lowest-rated part of the European high-yield market consists of only a few bonds, so a handful of very lowly trading names can drive the whole average significantly wider,” said Tatjana Greil-Castro, co-head of public markets at Muzinich. “We do see value in the European high-yield market, but one needs to know the names well and understand the refinancing risk of each individual issuer.”
Highly indebted telecoms group Altice holds the largest weighting in the European triple-C index, whose other constituents include German cable company Tele Columbus and travel group TUI Cruises. The US bond index includes cable group Dish, cinema chain AMC Entertainment, Viking Cruises and the US debt of Altice.
Still, Scott noted that “in order for that dispersion to arise in the first place, it really relies on fundamental drivers”.
Apollo’s Sløk added that “triple-Cs in the US and in Europe are a reflection of worries about a recession or not.
“If there is no [worry] about a recession in the US anymore — and much more worry about a recession in Europe — then it makes sense that the spread is widening out.”
Comments